Federal Reserve Economic Data: Your trusted data source since 1991

The FRED® Blog

Posts tagged with: "GCE"

View this series on FRED

Do government dollars drive recovery?

The conventional wisdom and data behind government spending during recessions

Conventional wisdom suggests that, once you determine the appropriate level of government spending on goods and services, this level should grow more or less in line with the growth of the broader economy. Keeping the growth rate of government spending stable over the business cycle helps stabilize the business cycle.

But let’s see what the data show: The FRED graph above plots (1) the percentage change year-to-year of total government spending on goods and services and (2) the employment-to-population ratio. The three shaded regions in the graph represent periods of recession, each characterized by a rapid decline in employment followed by a gradual recovery. But the growth in nominal government spending wasn’t the same across these three recessions: It decelerates in the early 1990s recession, remains relatively stable in the early 2000s recession, and declines precipitously into negative territory in the most recent recession.

The recessions themselves were also different: The recession in the early 2000s was noticeably mild. Was this in part due to the stable pace of government spending? In contrast, the 2007-09 recession was very deep and had a very slow recovery. Was this in part due to the unprecedented cuts in government spending? At the state and local level, these cuts were made largely in response to diminished state tax revenue and the inability to issue debt. At the federal level, they were motivated more by unwillingness to expand the federal debt even further.

Austerity during a downturn may have its merits. But the fiscal retrenchment during the most recent recession almost surely contributed to the recession’s severity and very slow recovery. Given that interest rates and inflation remained unusually low, it seems difficult to justify the sharp cyclical cuts in government spending that took place at that time. If a smaller government spending program is a long-term policy goal, the textbook recommendation is that this policy should be implemented only after the economy has fully recovered from recession.

How this graph was created: Search for “Government Consumption Expenditures and Gross Investment (GCE).” From the “Edit Graph” panel, change “Units” to “Percent Change from Year Ago.” Select “Add Line” in the same editing panel and search for the “Employment Population Ratio: 25 – 54 years.” Select the first result. Under “Edit Line 2” (still in the same editing panel), change “Units” to “Percent.” Finally, change the start and end dates on the graph to “1990-01-01” and “2019-12-01.”

Suggested by David Andolfatto and Mahdi Ebsim.

View on FRED, series used in this post: GCE, LNS12300060

Do imports subtract from GDP?

A basic explanation of GDP = C + I + G + (X-M)

The typical textbook treatment of GDP is the expenditure approach, where spending is categorized into the following buckets: personal consumption expenditures (C); gross private investment (I); government purchases (G); and net exports (X – M), composed of exports (X) and imports (M). Textbooks often capture this in one relatively simple equation:

GDP = C + I + G + (X – M).

Notice that, here, imports (M) are subtracted. On the surface, this implies that an extra dollar of spending on imports (M) will decrease GDP by one dollar. For example, let’s assume you spend $30,000 on an imported car; because imports are subtracted (e.g., “– M”), the equation seems to imply that $30,000 should be subtracted from GDP. However, this cannot be correct because GDP measures domestic production, so imports (foreign production) should have no impact on GDP.

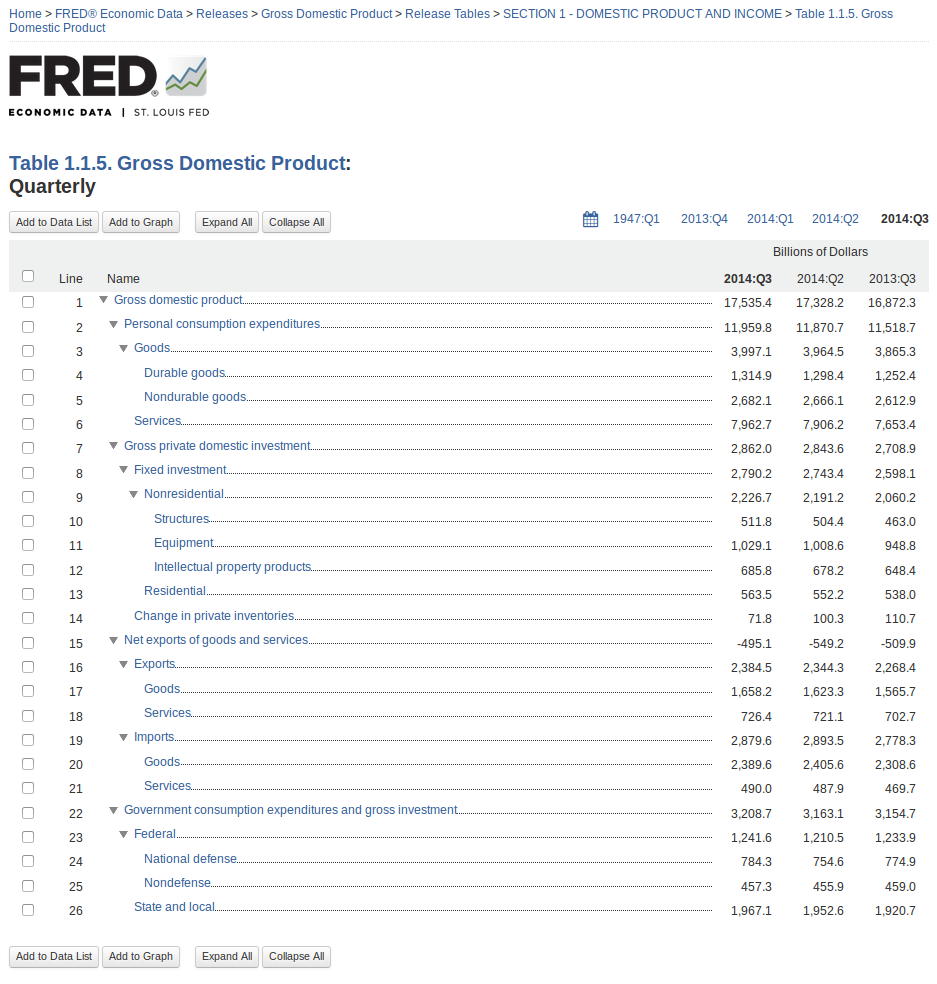
When the Bureau of Economic Analysis (BEA; see its primer on this topic) measures economic output, it categorizes spending with the National Income and Product Accounts (NIPA). Some of this spending (which is counted as C, I, and G) is spent on imported goods. As such, the value of imports must be subtracted to ensure that only spending on domestic goods is measured in GDP. For example, $30,000 spent on an imported car is counted as a personal consumption expenditure (C), but then the $30,000 is subtracted as an import (M) to ensure that only the value of domestic production is counted. As such, the imports variable (M) functions as an accounting variable rather than an expenditure variable. To be clear, the purchase of domestic goods and services increases GDP because it increases domestic production, but the purchase of imported goods and services has no direct impact on GDP.

The misconception that imports reduce GDP also seems to be implied when the GDP components are stacked using the FRED release view. Notice that the green “net exports” area is negative. This occurs because the dollar value of imported goods and services exceeds the value of exported goods and services. While this aspect of net exports (X – M) is useful for evaluating how international trade affects economic activity, it can be misleading. Like the misleading aspects of the expenditure equation, it suggests (visually) that imports reduce overall GDP. While the graph is not incorrect, it is important to keep in mind that, when calculating GDP, the value of imports is actually subtracted from the other components of GDP (personal consumption expenditures, gross private domestic investment, government consumption expenditures, and gross investment), not exports. Again, it’s important to emphasize that the imports variable (M) is an accounting variable rather than an expenditure variable.

To learn how to create your own GDP stacking graph, see this FRED blog post. For a more complete description of GDP and the expenditures equation, read the September 2018 issue of Page One Economics.

Suggested by Scott Wolla.

View on FRED, series used in this post: GCE, GPDI, NETEXP, PCEC

Graphing GDP components with our new release view

FRED makes it easy to create a stacked area graph of GDP components using our new release view feature:

How this graph was created: Navigate to the gross domestic product release page using the “Releases” link on the FRED homepage. Choose “Gross Domestic Product” (page 2) and then click on the “Section 1 – Domestic Product and Income” release link. Select Table 1.1.5 and then select the “Quarterly” series (they’re all quarterly). Now you have reached the components of GDP, and the page will look like this:

Screenshot from 2014-11-20 15:13:17

From here, you can easily see the components of GDP as a hierarchy with the latest value, the previous period’s value, and the value from a year ago. Check the boxes next to personal consumption expenditures, gross private domestic investment, net exports of goods and services, and government consumption expenditures and gross investment. Then click the “Add to Graph” button.

You’ll see a line graph of the four series. Under the graph tab, expand the “Graph Settings” menu. Change the graph type to “Area” and the stacking to “Normal.” Finally, so that net exports are easier to see, expand the menu for that series and click the “move down” button.

Suggested by Keith Taylor

View on FRED, series used in this post: GCE, GPDI, NETEXP, PCEC


Subscribe to the FRED newsletter


Follow us

Back to Top