
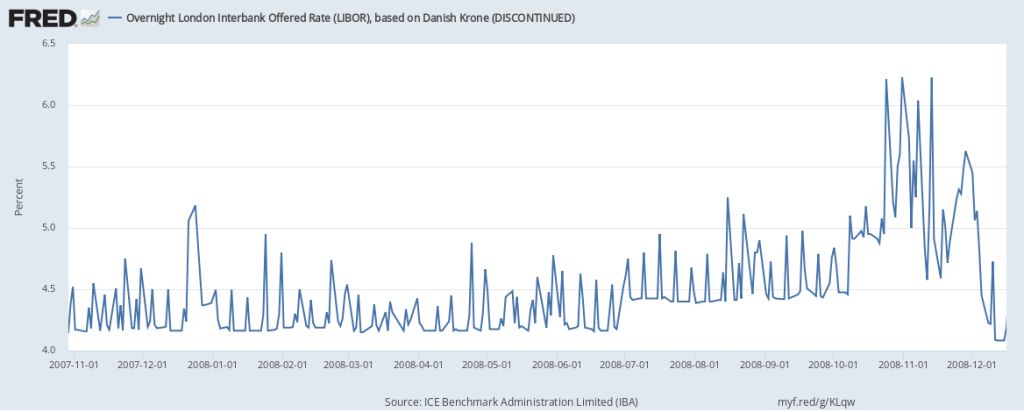
When we say “seasonal variation,” we’re referring to fluctuations in the data that follow a pattern according to the time of year. For example, retail trade is always higher just before Christmas. The sale of ski lift tickets is always higher during winter—at least in the Northern Hemisphere. Agricultural output is higher in the growing season. Could this variation also apply to interest rates? It turns out it can, under specific circumstances. In some markets, banks look for liquidity at various times. They typically face regulations that affect what they can carry in their books; depending on the country and other factors, they may have to satisfy these regulations every single day, at the end of the month, or on average over the month. The end-of-month option especially can introduce seasonality in overnight interest rates, as banks scramble to satisfy regulations at very specific times during the year. The graph above shows liquidity in euros, which spikes every last day of the month. The graph below, which covers banks in Denmark, shows a spike every Wednesday. (Special circumstances also apply, such as holidays: Note the spike on Monday, Christmas Eve 2007, for example.) In the lower graph, you can slide the sample window to the right to see that this spike does not always occur: Rules can change over time, as can general market conditions. In fact, at the very end of the sample (Sep. 2012 through March 2013), the spikes actually point down, as banks were trying to get rid of their excess liquidity.
How these graphs were created: NOTE: Data series used in these graphs have been removed from the FRED database, so the instructions for creating the graphs are no longer valid. The graphs were also changed to static images..
Suggested by Christian Zimmermann

