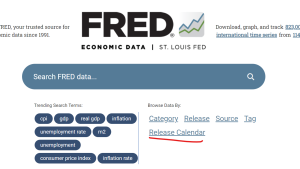
FRED provides not only data, but also a data release calendar. The calendar shows the dates and times of economic announcements from the US government and other sources. Simply click on “Release Calendar” on the FRED home page.

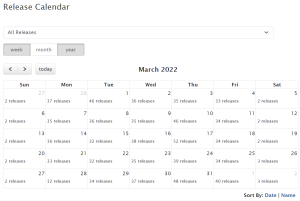
The default for the release calendar is the release data for the current week. But you can easily go back in time to find historical data in these releases: Use the radio button to choose weeks and months and the dropdown list to choose years. You can also select a specific type of release with that pulldown menu.
Example 1: If you select, say, the year 2022 and the month of March, and you leave the pulldown menu set to its default of “All Releases,” then you’ll see a calendar of all the releases for each day in March 2022. Click on the releases link on a particular day in the calendar, and links for the releases on that day will appear below the calendar.

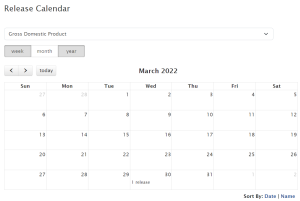
Example 2: If you select March 2022 but select “Gross Domestic Product” (GDP) from the pulldown menu, you’ll see all the GDP releases for that month. Turns out, there was only one GDP release that month: at 7:30 AM, Central Time, March 30, 2022. Click the link on March 30, 2022, on the calendar to see information below the calendar. The link on the left goes to the historical GDP data series page, which provides both nominal and real GDP measures and breakdowns of GDP by personal and government categories. The status column on the right displays the term “Updated,” which indicates this FRED series has indeed been updated with this March 30, 2020, data release.

There are at least a few reasons why you might want to know about the dates of data releases.
Newly released data can move financial markets and generate news stories. If you look at the releases for a given day, you can then see which releases may have made an impact, including which releases the financial press judged to be important.
If you are testing historical forecasts, you want to see when a particular type of data was released to know exactly when it could have been used in those forecasts. If you’re testing, say, the use of GDP to predict some other variable, then you want to have the best estimate of GDP available on that specific forecast date. (For variables such as GDP, which are revised after their initial release, you likely want to look up the original vintage—i.e., the value of the initial release of GDP on a specific date—on ALFRED.)
And you might want to know when important data releases will occur so that you’re prepared for them and the possibility of short-term volatility that may occur in financial markets. Research indicates that the most important announcements for financial markets are monetary policy announcements and employment data releases.
This release calendar is just one way FRED provides economists and anyone who loves economics with data and information for economic decisionmaking.
Suggested by Christopher Neely.


