Federal Reserve Economic Data

The FRED® Blog

Unequal employment recovery since the pandemic

US employment has largely returned to pre-pandemic levels since the COVID-related disruptions. But this recovery hasn’t been even across the labor market. So we use FRED* to illustrate the recovery in employment according to establishment size: 1-19, 20-49, 50-249, 250-499, and 500+ employees.

Before the pandemic, employment across all establishment sizes had been slowly increasing. Predictably, employment dropped in March 2020 for all size categories.

  • For the smallest establishments (1-19 employees), employment dropped the least and recovered the fastest; however, employment in these establishments has fallen slightly since the end of 2021.
  • For establishments with 20-49 employees, 250 to 499 employees, and 500+ employees, employment has followed a similar pattern, increasing above employment levels from 2020.
  • For mid-range establishments with 50 to 249 employees, employment dropped the most and recovered the slowest.

Employment across all establishment sizes is now above the levels in January 2020. And while the initial drop in employment came from COVID-19 for all establishments, it is unclear why the various drops and recoveries have been so uneven across establishment sizes. One possible explanation is the agility of smaller firms and the deeper resources of large firms. The smallest establishments could remain at work or go back to work faster due to lower risk of exposure to COVID given a smaller number of employees. The largest establishments also have the resources to establish COVID procedures and testing to help employees get back to work.

The mid-range establishments may have struggled more than other size groups because their number of employees was too large to return without rigorous prevention measures and too small to have the resources to fight for and secure scarce COVID-19 tests. Business applications for new firms have increased, and new firms tend to be small. This could also explain why small firms saw the smallest decline and fastest recovery.

*Notes about the data: The data set is from Automatic Data Processing Inc. (ADP), which defines an establishment as a single physical location engaged predominantly in one activity and covers US nonfarm private employment. To focus on the employment patterns before and after the pandemic, we index the employment level to January 2020 (right before the pandemic) and graph the data from 2018 to the latest observation available.

How this graph was created: Search FRED for “Small Establishments” and select “Nonfarm Private Employment in Small Establishments with 1 to 19 Employees.” Select the orange “Edit Graph” button to get to the “Add Line” section, where you’ll search for “Small Establishment” in the search bar and select the series “Nonfarm Private Employment in Small Establishments with 20-49 Employees.” Repeat for “Medium Establishments” and “Large Establishments.” Use “Edit Line 1” to change the units to “Index (Scale value to 100 for chosen date),” which is “2020-01-01,” and select “Copy to all.” Finally, change the start date of the graph to 2018-01-01.

Suggested by Maggie Isaacson and Hannah Rubinton.

Comparing the racial dissimilarity index across counties

Larger counties are more dissimilar than smaller counties

A previous FRED Blog post explained racial dissimilarity, with St. Louis City and St. Louis County as examples. In this post, we look at racial dissimilarity with a map of all US counties.

The Census Bureau identifies racial housing patterns in a county by calculating the “White to non-White racial dissimilarity index,” which ranges in value between 0 and 100. The value represents the percent of the non-Hispanic White population who would have to move from one census tract in a county to another census tract in the same county to achieve an even countywide distribution of racial groups. (See the explanations from the Census Bureau.)

The FRED map above shows racial dissimilarity data for 2021, the latest at the time of this writing. Darker colors represent more racially dissimilar counties. The grayed-out counties have only one Census tract, so it’s impossible to calculate an index for them.

At first glance, no geographical concentration of highly dissimilar counties is easily noticeable. The counties where more than half of the non-Hispanic White population would have had to change where they lived for this specific type of racial dissimilarity to disappear are, in fact, peppered across the country. However, the concentration of grayed-out areas in sparsely populated parts of the country suggests there is a relationship between the size of the population in a county and its racial dissimilarity index. We created a scatter plot of those data to look into this idea.

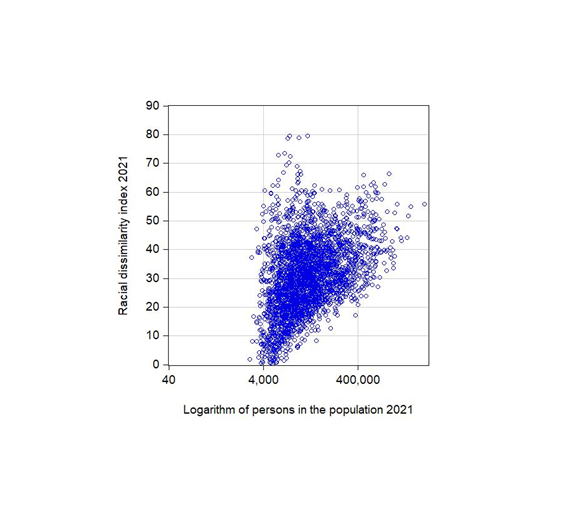
Each blue circle in our second data graph represents a county: Its racial dissimilarity index is on the vertical axis and its population size is plotted on the horizontal axis. The shape of the data cloud indicates that, on average, as population size increases, the racial dissimilarity index grows. In other words, Census tracts in more-populous areas are less alike than Census tracts in less-populous areas.

However, even among relatively large counties, there is remarkable variation in racial housing patterns. Consider, for example, two counties with almost exactly 400,000 residents: Genesee County, MI, and St. Charles County, MO. The racial dissimilarity index for the Michigan county (57) is more than twice as high as the racial dissimilarity index for the Missouri county (21). So population size is not all that matters here.

How this map was created: In FRED, search for “White to Non-White Racial Dissimilarity (5-year estimate) Index for St. Louis city, MO.” Click on “View Map.” To change the data units into annual growth rates, click on “Edit Map” and select “Units: Percent change from year ago.” How the scatter plot was created: We use a logarithmic scale to plot the population data because, in 2021, population across counties ranged from 2,052 persons to more than 10 million persons. Those numbers could not be easily visualized in a simple graph with linear scales.

Suggested by Diego Mendez-Carbajo.

Updating the name of the television services series in the CPI

Fine-tuning the data to improve the picture quality

FRED aggregates data from various sources. Those sources routinely revise and update the data they produce. After all, more-accurate data allow for better decisionmaking. These sources also update the names of their data series to accurately describe the activity they record. FRED incorporates these updates with an automated process.

One source, the Bureau of Labor Statistics, provides the consumer price index (CPI) dataset, which measures the average change over time in the prices paid by urban consumers. The FRED graph above displays one CPI data series that had its name changed as of February 14, 2023: from “Cable and satellite television service” to “Cable, satellite, and live streaming television service.”

This update to the series name reflects the addition of customizable internet-based live streaming of television services, which had been commonly provided via land cable and satellite wireless signals.

So what does this FRED graph show? The time period is January 1992 to December 2022, the units are percent change from a year ago, and the values are the year-over-year inflation rate of television service prices. These prices had some cyclical ups and downs but were trending downward until 2011, when that declining trend reversed. In fact, price growth for television services has markedly outpaced total price growth for its parent category, recreation services.

Stay tuned to the FRED Blog for more news of updates to additional data series names.

How this graph was created: Search FRED for “Cable, satellite, and live streaming television service.” Next, click the “Edit Graph” button, select the “Line 1” tab, and use the “Units” dropdown menu to select “Percent Change from Year Ago.” Last, select the “Format” tab to change the graph type to “Bar.”

Suggested by Diego Mendez-Carbajo.


Back to Top