Federal Reserve Economic Data

The FRED® Blog

Posts tagged with: "DEXUSUK"

View this series on FRED

Coronavirus effects on exchange rates

This FRED graph shows several exchange rates relative to the U.S. dollar. We start with the date January 6, 2020, where we set the index values equal to 100 for all these exchange rates so we can compare their relative changes since then. Through the end of February, most of these exchange rates have remained relatively stable; however, they began to increase in March. Brazil’s and Mexico’s exchange rates spiked, and their currencies have depreciated nearly 30% since the beginning of January.

In March, the COVID-19 pandemic became more severe, affecting overall economies as well as exchange rates. Reduced global demand for commodities such as oil has sent commodities prices crashing; Mexico and Brazil are major commodities-exporting countries. Canada’s and the U.K.’s exchange rates spiked at the beginning of March, but they seem to have recovered by the end of March. The euro seems to be unaffected by the global pandemic, at least compared with the U.S. dollar. China’s exchange rate, on the other hand, has remained constant despite the coronavirus originating there. Unlike the rest of the countries in our sample, which have floating exchange rates, China has a fixed exchange rate pegged to the U.S. dollar.

Large exchange rate movements can have consequences for economic growth, inflation, trade, and sovereign risk. Commodity-dependent economies and developing countries are most susceptible to this risk. It will be important to monitor the impacts of the coronavirus on international markets and economies because they will impact our interconnected, global economy.

How this graph was created: Start with a graph of any exchange rate. From the “Edit Graph” panel, use the “Add Line” tab to search for each exchange rate by its code and add it to the graph. Under “Edit Lines,” go to the dropdown box “Units” and select “Index (Scale value to 100 for chosen date).” Immediately below, under the heading “Select a date that will equal 100 for you custom index,” type in “2020-01-06.” Do this for all lines. For the euro and the pound, the original series have the U.S. dollar in the numerator, so we have to transform them to make them comparable to the other series. To do this, go to “Formula” and type 1/a and click “Apply.”

Suggested by Brian Reinhold and Yi Wen.

View on FRED, series used in this post: DEXBZUS, DEXCAUS, DEXCHUS, DEXMXUS, DEXUSEU, DEXUSUK

Currency arbitrage in the precious metals market: A gold rush?

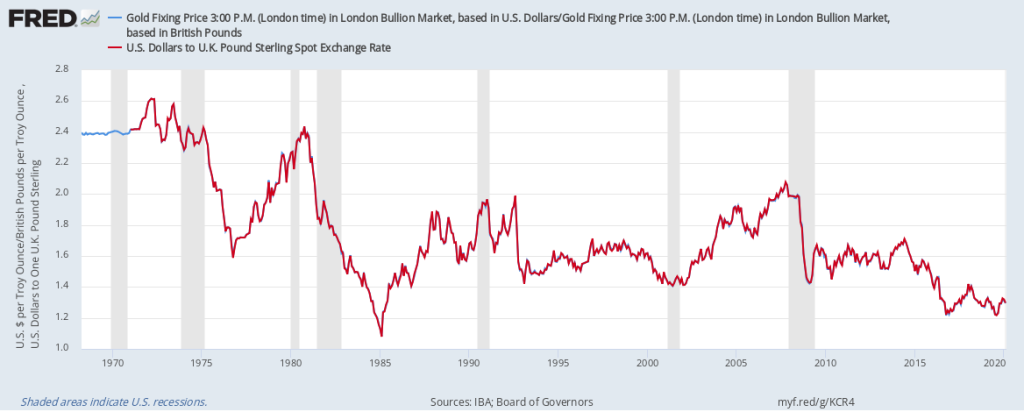
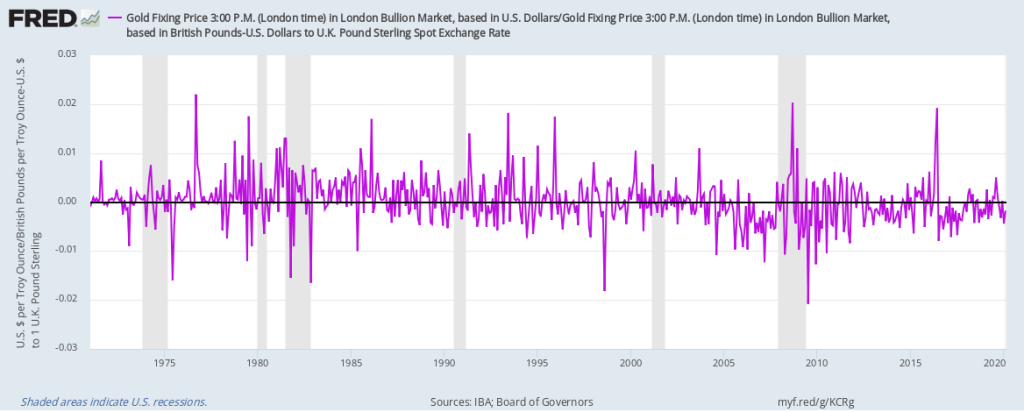
FRED’s as good as gold, and the FRED Blog has used London Bullion Market Association data to prove it. In fact, our previous post tracks gold prices and appraises the new gold bar at the St. Louis Fed. Now these gold prices are quoted in three different currencies—U.S. dollars, British pounds, and euros—which is a golden opportunity to discuss arbitrage. Arbitrage is the risk-free purchase and sale of an asset to profit from a difference in price across markets. Because the gold fixing price is quoted in three different currencies at once, it’s possible that one could make a profit by buying and selling gold in different currencies and then selling the currencies. For example: buy gold in U.S. dollars, sell the gold right away in British pounds, and then convert the pounds back to dollars in the foreign exchange market. FRED can help us visualize this shiny concept: In the graph above, we show the ratio of the gold fixing price in U.S. dollars to the gold fixing price in British pounds. Then we graph the exchange rate between the U.S. dollar and the British pound. The two lines seem identical, so there’s no obvious arbitrage opportunity here. But let’s dig deeper by building another FRED graph to show the difference between the U.S. dollar/British pound gold fixing price ratio and the exchange rate between the two currencies. If there really is no arbitrage opportunity, the graph should show a flat horizontal line at the zero mark.
This doesn’t look like a flat line, so did we find treasure?! Sadly, no. The graph shows differences in gold fixing prices between currencies, but they are extremely small and volatile. So small they’d likely be wiped out by transaction costs, such as brokerage fees in the precious metals and/or foreign currency markets. Rather than a gold mine, we seem to have found just some gold dust. How these graphs were created: NOTE: Data series used in these graphs have been removed from the FRED database, so the instructions for creating the graphs are no longer valid. The graphs were also changed to static images. Suggested by Diego Mendez-Carbajo.
View on FRED, series used in this post: DEXUSUK, GOLDPMGBD228NLBM, GOLDPMGBD229NLBM

Election surprises and exchange rates

Some election results are expected, and some come as a surprise. As people and markets adjust their expectations for the future with this new information, some financial variables may move around quite a bit.

The graph refers to two recent elections whose actual outcomes didn’t match forecasters’ expected outcomes: the British referendum vote on whether to stay in the European Union (a.k.a. Brexit) on June 23, 2016, and the recent U.S. presidential election on November 8, 2016. The red line shows the British pound per dollar exchange rate, and the blue line shows the Mexican peso per dollar exchange rate. Each series is centered on its respective election and indexed to 100 at the date of that election. (The interruptions in the lines show when markets were closed.)

In both cases, the value of the dollar relative to these currencies appreciated around 10% from the previous day’s value. This appreciation may reflect a negative (or less positive) revision to individuals’ expectations about the future of the British and Mexican economies based on the election outcomes.

How this graph was created: From the FRED homepage, search for and select the series “Mexico/U.S. Foreign Exchange Rate.” Then use the “Add Line” feature to search for and select “U.K./U.S. Foreign Exchange Rate” and add the series in dollars per British pound. To achieve a pounds-per-dollar series, under “Edit Line,” use the customize data section and type 100/a*100 in the formula box and click “Apply.” Finally. adjust the units of both series by selecting the “Index” option in the “Units” menu. Choose a custom date of 2016-06-23 for the pound and 2016-11-08 for the peso. Select the option to display integer periods instead of dates, and set the range to be -20 to 20 for all series.

Suggested by Max Dvorkin and Hannah Shell.

View on FRED, series used in this post: DEXMXUS, DEXUSUK


Subscribe to the FRED newsletter


Follow us

Back to Top