No. This isn’t the plot of a National Treasure sequel. It’s the latest addition to the St. Louis Fed’s Economy Museum: a 9.75” long, 1.5” tall bar of gold on loan from the Mint. Because the bar is 99.999% pure gold, it weighs 28 pounds! So, how much does a 28-pound gold bar cost?
Let’s use FRED data to figure out the price of this bar, which is on display, coincidentally, right across from the museum’s FRED exhibit.
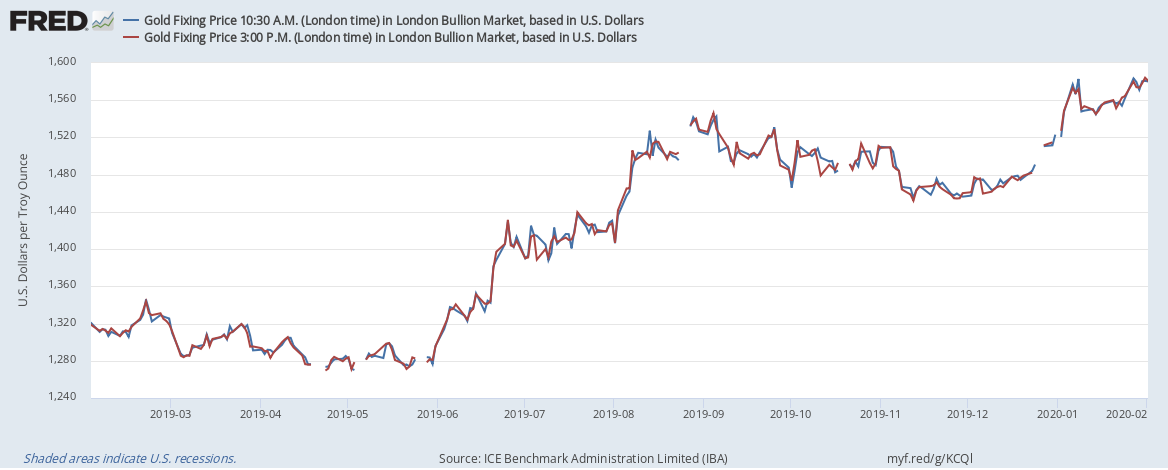
Although some people see gold as a hedge against inflation, the graph above shows just how volatile the price of gold can be. Here, we have the “fixing price” of a troy ounce of gold in U.S. dollars in the London bullion market. London is the largest trading center for precious metals, and gold prices are reported daily at two different times (10:30 AM and 3:00 PM London time) to account for these intra-day variations.
Sorry, but now we have to do some math. There are 14.5833 troy ounces in a pound, and the museum’s gold bar weighs 28 pounds. That’s 408.3324 troy ounces. Much like gold, FRED is very malleable; so we can customize the data to reveal the price of the entire bar. In the graph below, we’ve applied the formula a * 408.3324. Clearly, changes in global supply and demand affect the price. And, between January 1 and February 10, 2020, the price of the bar has ranged from $623,564.41 to $646,880.19.
If you visit the Economy Museum, you’ll have the chance to try to lift this bar yourself. Before you visit, though, you may want to eat your spinach: 28 pounds is no small weight. Speaking of, the bar is literally worth its weight in gold, but what about its weight in cash? At its highest, the price of the gold bar would be a little more than 14 pounds of (mostly) $100 bills. If, you’re interested, the formula $646,880.19 / $100 * 1 gram/bill * 0.00220462 pound/gram gets you there.
By the way, FRED fans: The Economy Museum also sells FRED t-shirts! Unfortunately, we have no price or weight data for those…
How these graphs were created: NOTE: Data series used in these graphs have been removed from the FRED database, so the instructions for creating the graphs are no longer valid. The graphs were also changed to static images.
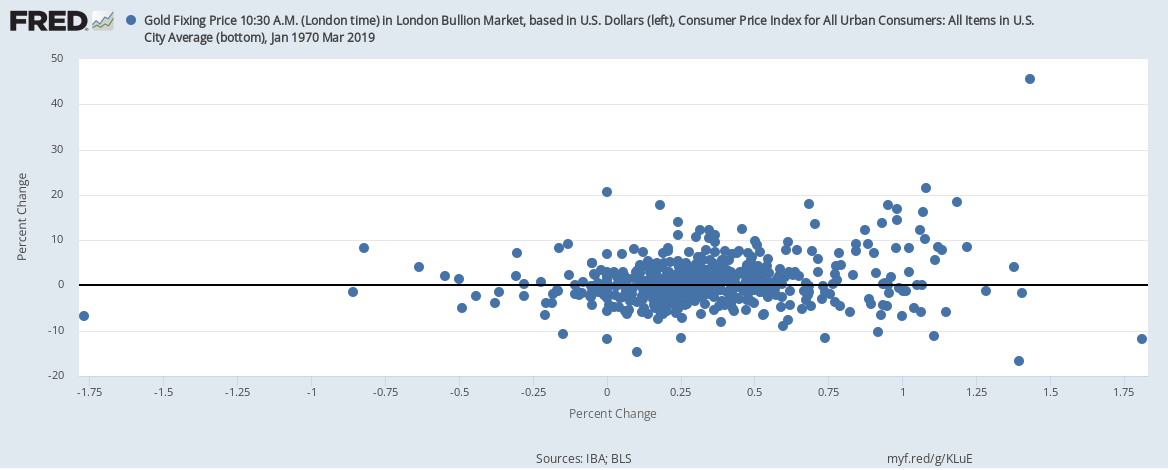
According to conventional wisdom, holding gold is a good way to protect oneself against inflation. But let’s try to understand this wisdom a little better with the help of some FRED graphs. The graph above simply shows the monthly general inflation rate (from the CPI) and the monthly gold inflation rate. But this line graph doesn’t offer a very clear picture: The fluctuations in the price of gold are much larger than those for prices in general. So, instead, let’s try a scatter plot, shown below, where every point corresponds to a particular month and its pair of inflation rates. But, again, there’s not much to see here.
Now you may be asking, isn’t it true that, if the general price level is rising, so is the price of gold? To really measure how gold has appreciated, then, we need to remove CPI inflation from gold inflation. The resulting scatter plot is below. Not much of a difference, unfortunately, mostly because there’s not much variation in CPI inflation compared with the variation in gold inflation. (Compare the different ranges on each axis.)
OK. Last try. In the graph below, we switch from monthly inflation to yearly inflation for both measures. And, again, there’s not much of a relationship to see here except when CPI inflation is really high—on the right side of the plot. There, higher CPI inflation is indeed associated with high gold inflation. But this is statistically tenuous because it’s based on only a few data points.
By the way, the practice of massaging the data in many ways is called data mining. Showing only the particular combination that worked out while hiding all the specifications that did not is not considered good research practice.
How these graphs were created: NOTE: Data series used in these graphs have been removed from the FRED database, so the instructions for creating the graphs are no longer valid. The graphs were also changed to static images.
Despite appearances, the graph above has two lines. If you look really closely, you can see a second color peeking out here and there. And what two series are these that track each other so closely? One is the daily price of gold in London as of 10:30 a.m. The other is also the daily price of gold in London but as of 3 p.m. You’d expect these prices to be very close to each other, but let’s graph the percentage change between the price at 10:30 a.m. and 3 p.m. to see exactly how similar they are.
In fact, what we have here is a fairly volatile series.* Many of these price changes, which occur within 4.5 hours of each other, are in the range of 1% to 2%. Some even more. This rate of change is about the same as the rate of inflation in the U.S. Such changes in commodity prices aren’t uncommon, of course, even if trading occurs around the clock on world markets. The London market is open 8 a.m. to 5 p.m. (London time). These series are just snapshots during part of that time, but market activity continues in a similar fashion at other times and elsewhere.
How these graphs were created: NOTE: Data series used in these graphs have been removed from the FRED database, so the instructions for creating the graphs are no longer valid. The graphs were also changed to static images.
* NOTE: Because there are many daily observations for the period shown, the graph offers only a sample of them. To see the details, just shorten the sample time.