The June 13, 2019, FRED Blog post showed how, in a world of ample reserves, the FOMC sets a target range for the federal funds rate (FFR) and uses interest on excess reserves (IOER) and the overnight reverse repurchase agreement facility (ON RRP) to keep the FFR rate in the target range.
Since July 2019, the FOMC has lowered the target range for the FFR twice, effectively injecting liquidity into the banking system. And, at the September 17-18 FOMC meeting, the committee announced a 0.25% cut in the target rate, with an accompanying cut in the interest rate on excess reserves. But ahead of that meeting, the effective FFR spiked, exceeding the upper limit of the target range. So, an additional monetary policy tool was put into action.
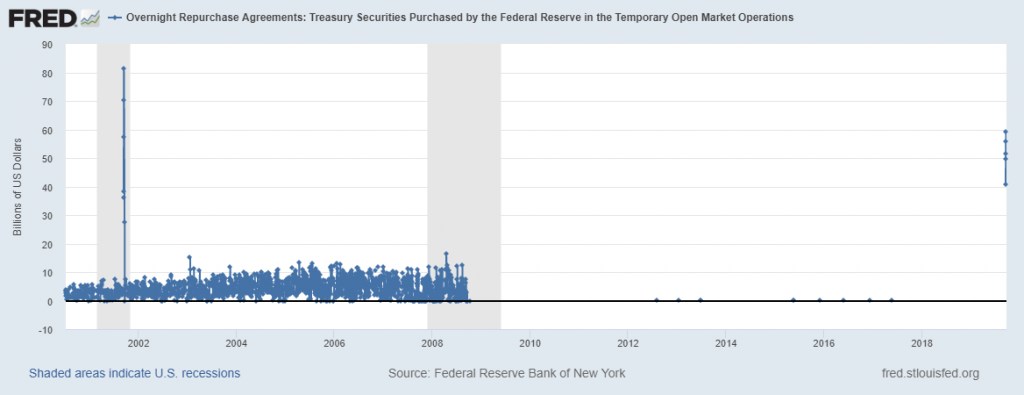
On September 17, 2019, the Federal Reserve Bank of New York began conducting temporary open market operations through overnight repurchase agreements: That is, it purchased Treasury securities held by banks. The FRED graph above shows these recent operations. By default, FRED graphs with daily data show the past 5 years, so these temporary operations look like an ant parade along the x axis that lead to the recent interventions high in the stratosphere of the upper right corner. However, if you expand the graph to show the available data (by adjusting the date slider below the graph), you see these operations occurred almost every day up to 2008. We show this bigger picture in the graph below.
How these graphs were created: Search for “temporary open market operations” and select the “Overnight Repurchase Agreements: Treasury Securities Purchased by the Federal Reserve in the Temporary Open Market Operations (RPONTSYD)” series and click “Add to Graph.” Note that there’s a large number of daily observations here, so the FRED graph automatically does some sampling of the data. In FRED itself, expanding the scroll bar date range will reveal all the data points, which is shown below.