Federal Reserve Economic Data: Your trusted data source since 1991

The FRED® Blog

Mark your FRED data release calendar

How to dig into the history of FRED data releases

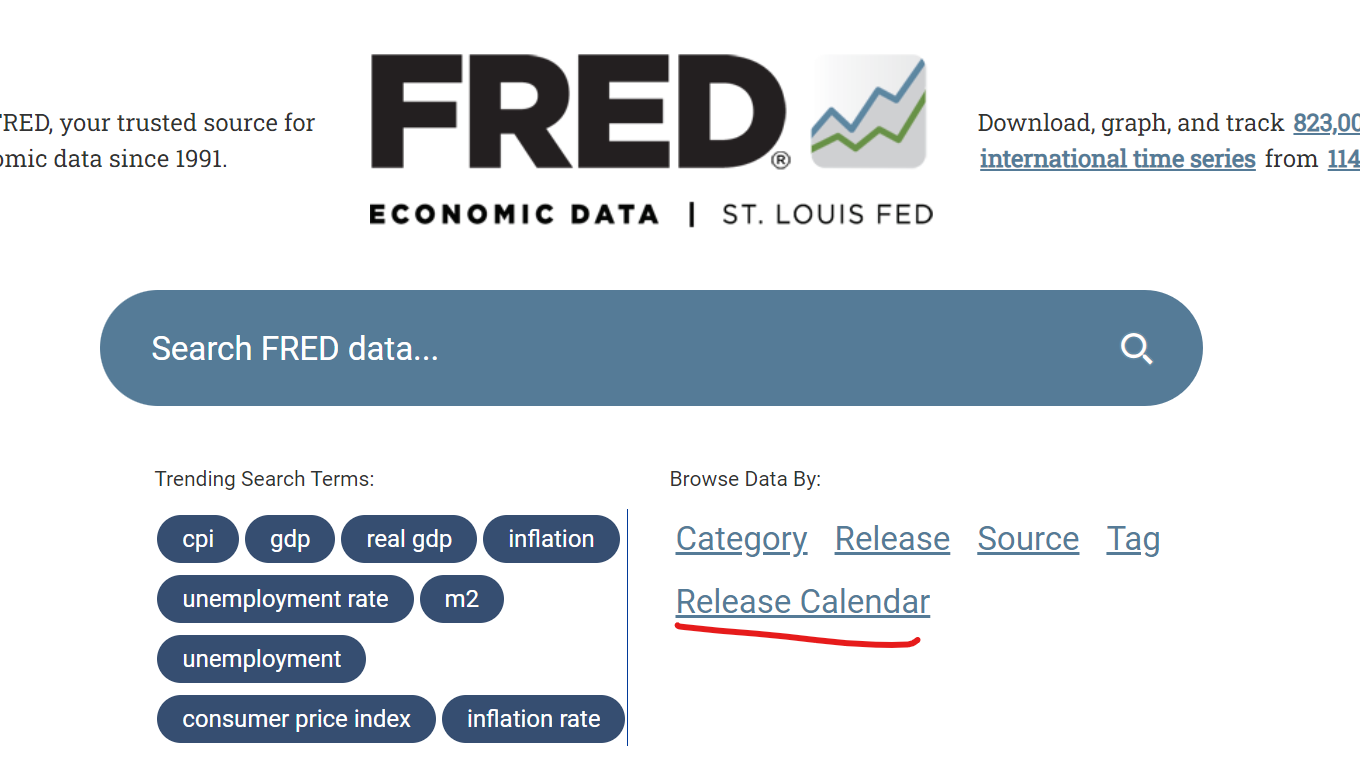
FRED provides not only data, but also a data release calendar. The calendar shows the dates and times of economic announcements from the US government and other sources. Simply click on “Release Calendar” on the FRED home page.

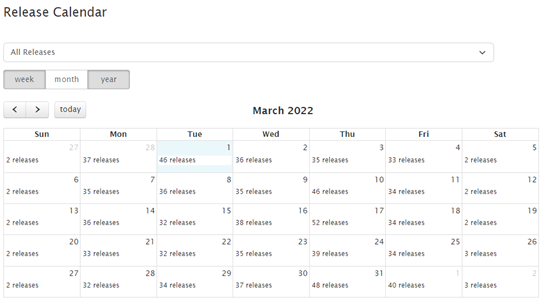
The default for the release calendar is the release data for the current week. But you can easily go back in time to find historical data in these releases: Use the radio button to choose weeks and months and the dropdown list to choose years. You can also select a specific type of release with that pulldown menu.

Example 1: If you select, say, the year 2022 and the month of March, and you leave the pulldown menu set to its default of “All Releases,” then you’ll see a calendar of all the releases for each day in March 2022. Click on the releases link on a particular day in the calendar, and links for the releases on that day will appear below the calendar.

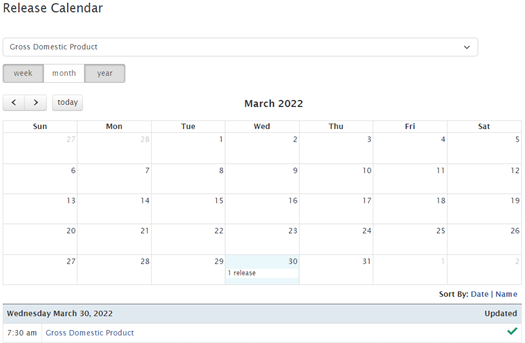
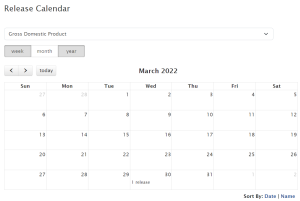
Example 2: If you select March 2022 but select “Gross Domestic Product” (GDP) from the pulldown menu, you’ll see all the GDP releases for that month. Turns out, there was only one GDP release that month: at 7:30 AM, Central Time, March 30, 2022. Click the link on March 30, 2022, on the calendar to see information below the calendar. The link on the left goes to the historical GDP data series page, which provides both nominal and real GDP measures and breakdowns of GDP by personal and government categories. The status column on the right displays the term “Updated,” which indicates this FRED series has indeed been updated with this March 30, 2020, data release.

There are at least a few reasons why you might want to know about the dates of data releases.

Newly released data can move financial markets and generate news stories. If you look at the releases for a given day, you can then see which releases may have made an impact, including which releases the financial press judged to be important.

If you are testing historical forecasts, you want to see when a particular type of data was released to know exactly when it could have been used in those forecasts. If you’re testing, say, the use of GDP to predict some other variable, then you want to have the best estimate of GDP available on that specific forecast date. (For variables such as GDP, which are revised after their initial release, you likely want to look up the original vintage—i.e., the value of the initial release of GDP on a specific date—on ALFRED.)

And you might want to know when important data releases will occur so that you’re prepared for them and the possibility of short-term volatility that may occur in financial markets. Research indicates that the most important announcements for financial markets are monetary policy announcements and employment data releases.

This release calendar is just one way FRED provides economists and anyone who loves economics with data and information for economic decisionmaking.

Suggested by Christopher Neely.

The Fed’s support of international financial stability

Data on central bank liquidity swaps

The Federal Reserve’s mission includes promoting the health of the US economy and the stability of the US financial system. One way the Fed accomplishes this is through standing liquidity swap lines with several foreign central banks. Swap transactions are designed to support financial stability by improving liquidity conditions in dollar funding markets at home and abroad. How do these transactions work and how often are they used?

The FRED graph above shows the weekly dollar amount of central bank liquidity swap transactions between the Federal Reserve and authorized foreign central banks between mid-December 2002 and mid-October 2023. The data are reported in the H.4.1 release from the Board of Governors of the Federal Reserve System.

As described by the Board of Governors, a swap involved two transactions:
“When a foreign central bank draws on its swap line with the Federal Reserve, the foreign central bank sells a specified amount of its currency to the Federal Reserve in exchange for dollars at the prevailing market exchange rate. The Federal Reserve holds the foreign currency in an account at the foreign central bank. The dollars that the Federal Reserve provides are deposited in an account that the foreign central bank maintains at the Federal Reserve Bank of New York. At the same time, the Federal Reserve and the foreign central bank enter into a binding agreement for a second transaction that obligates the foreign central bank to buy back its currency on a specified future date at the same exchange rate. The second transaction unwinds the first. At the conclusion of the second transaction, the foreign central bank pays interest, at a market-based rate, to the Federal Reserve. Dollar liquidity swaps have maturities ranging from overnight to three months.”

The noticeably large spikes in the data correspond to time periods when international dollar liquidity was strained due to heightened uncertainty: during the Great Recession of 2007-2009, during the European sovereign debt crisis of 2011, and during the COVID-19-induced recession of 2020.

The Federal Reserve operates these swap lines under the authority of section 14 of the Federal Reserve Act and in compliance with authorizations, policies, and procedures established by the Federal Open Market Committee.

How this graph was created: Search the alphabetical list of FRED releases for “H.4.1 Factors Affecting Reserve Balances” and select “Table 1. Factors Affecting Reserve Balances of Depository Institutions Wednesday Level.” Select the data series “Central bank liquidity swaps.”

Suggested by Diego Mendez-Carbajo.

Multi-family construction slows as single-family construction picks up

Immediately after the Federal Reserve began increasing interest rates in March 2022, construction activity in the single-family housing market began to slow. Homebuilders had been facing higher costs and construction delays due to supply chain disruptions. In many cases prospective buyers of these new homes had agreed to purchase in the preceding months; but as mortgage rates rose, the effective cost of purchasing these homes rose, too, lowering their demand. Faced with weaker demand and a backlog of projects to complete, single-family homebuilders started fewer new homes and focused on completing existing projects.

Single-family housing starts dropped 32% between March and December of 2022, eventually leading to a decline in overall homes under construction. The FRED graph above shows the monthly data for single-family units under construction in red. You can see that, by mid-spring 2022, the number of single-family houses under construction had begun its fastest downward trend since the 2006-2009 period, falling at an average rate of roughly 9,800 units per month between May 2022 and September 2023. It’s worth noting that the single-family housing market hasn’t reacted so strongly to previous federal funds rate increases. Between November 2015 and January 2019, single-family units under construction continued to increase in the face of rate hikes, as it did between June 2004 and February 2006.

The story is different when we look at multi-family housing, shown in blue in the same FRED graph. The number of multi-family projects has mostly continued to climb over the past 16 months. Longer permitting and construction timelines in the multi-family space have kept the number of projects growing despite higher interest rates and costs. In fact, the number of multi-family projects under construction reached an all-time high in July 2023. The multi-family buildup has generally kept the total combined number of single- and multi-family units under construction stable around its own record-setting high of 1.7 million per month, as shown in the FRED graph below. It’s also worth noting that the single- and multi-family markets have not been so divergent in the past but were not always perfectly synchronized. When single-family units under construction embarked on its nearly 6-year slowdown in February 2006, multi-family units remained largely flat until July 2008 and began to bounce back almost a year before single-family units.

Trends have shown some change, though, for both multi-family and single-family construction. While the number of multi-family projects under construction in September 2023 remains about 10% higher than in September 2022, new multi-family projects started is more than 30% lower compared with the same time last year. This signals a slowdown in the number of multi-family projects under construction extending into 2024. But green shoots are beginning to sprout again in the single-family market, with housing starts picking up in recent months. (Starts are about 9% higher this September relative to one year ago.) This is welcome news for construction employment, which has so far proven resilient throughout the single-family slowdown, attributable to construction projects remaining historically elevated and evidence of a shortage of construction workers.

How this graph was created: Top graph: In FRED, search for and select “New Privately-Owned Housing Units Under Construction: Units in Buildings with 5 Units or More.” From the “Edit Graph” panel, use the “Add Line” tab to search and select “New Privately-Owned Housing Units Under Construction: Single-Family Units.” Bottom graph: In FRED, search for and select “New Privately-Owned Housing Units Under Construction: Total Units.”

Suggested by Charles Gascon and Joseph Martorana.


Subscribe to the FRED newsletter


Follow us

Back to Top