Federal Reserve Economic Data

The FRED® Blog

Posts tagged with: "CPIFABSL"

View this series on FRED

Are we expecting too much inflation?

CPI vs. University of Michigan's survey of consumers' inflation expectations

This FRED graph compares expected inflation and actual inflation. In recent years, expectations (in red) have been consistently above realizations (in blue). Why?

How people form expectations is a fascinating topic, as expectations drive so many economic decisions. One important point here is that, individually, we notice relatively few prices in an inflation measure. That is, individuals buy fewer goods than are included in the basket that determines the CPI. Also, we tend to recall only a few of the prices we encounter, in particular those that changed or changed more than we might have expected. (Read more about individual perceptions and bias.)

The graph below shows there’s quite a bit of variance in price changes across categories of goods. As expectations of future inflation are largely determined by perceptions of past inflation, the end result is an upward bias in expectations.

How these graphs were created: For the first graph, click on the CPI link on the FRED home page: Use the “Edit Graph” panel to change units to “Percent change from year ago.” Use the “Add Line” tab to search for “inflation expectation” and use the Michigan index. Restrict the sample period to start in 2017. For the second graph, start from the CPI release table, check the desired components, and click “Add to Graph.” Then use the “Edit Graph” panel to change the frequency of each line to “Annual, end of period.” Finally, in the “Format” tab, change graph type to “Bar”, close the tabs, and select period 2017-01-01 to 2020-01-01.

Suggested by Christian Zimmermann.

View on FRED, series used in this post: CPIAPPSL, CPIAUCSL, CPIEDUSL, CPIFABSL, CPIHOSSL, CPIMEDSL, CPIRECSL, CPITRNSL, CUSR0000SAG1, MICH

A New Year’s resolution: More homemade food

Food prices for dining out vs. staying home

Here at the FRED Blog we’re continuously looking for self-improvement opportunities, and our New Year’s resolution is to focus on home-cooked foods. Food at home is often fresher and healthier, but it’s also less expensive: The graph above shows that the cost of food away from home has been increasing much faster than the average of all foods. We’ll try to pepper the FRED Blog with healthier and tastier posts all through the year.

How this graph was created: Search for “CPI food,” check the two series, and click “Add to Graph.”

Suggested by Christian Zimmermann.

View on FRED, series used in this post: CPIFABSL, CUSR0000SEFV

What if we priced food in gold?

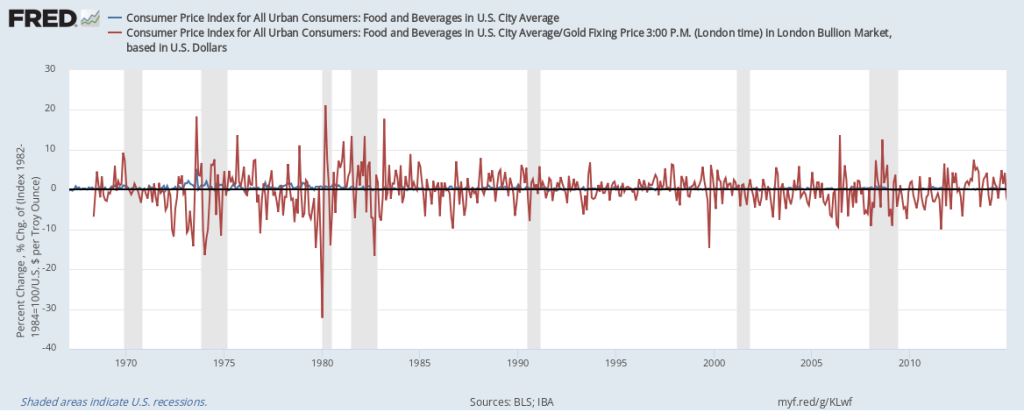
Imagine paying for food not in dollars, but in gold. How different would the world be? The graph above is an attempt to depict the difference it would make to food prices. Taking the subcategory “food and beverages” in the consumer price index, we compare the price in dollars (in blue) with the price in gold (in red). The graph shows month-to-month percentage price changes. The price in gold is calculated by dividing the price index by the price of gold in dollars. The graph makes very apparent that, if we priced food in gold, there would be wild fluctuations in those food prices. Consider the units on the vertical axis: Prices change several percent in either direction from one month to the next. But would price fluctuations really be that wild? Probably not, as it’s costly for sellers to change prices (“menu costs”) and they would make those changes less frequently than the graph shows. Yet, the essential premise remains: The Fed has a mandate to keep prices (in dollars) stable, which it can do by managing the money supply. Such stability is not possible with the gold supply. It is thus unavoidable that gold-based prices would fluctuate more. How this graph was created: NOTE: Data series used in this graph have been removed from the FRED database, so the instructions for creating the graph are no longer valid. The graph was also changed to  a static image. Suggested by Christian Zimmermann
View on FRED, series used in this post: CPIFABSL, GOLDPMGBD228NLBM


Subscribe to the FRED newsletter


Follow us

Back to Top