Yesterday was International Women’s Day, so FRED is taking the opportunity to examine one economic contribution from women that’s often ignored: The value of women’s domestic labor that goes unpaid.
For this calculation, we use Oxfam’s methodology: We calculate the total amount of hours that women spend doing unpaid household work and then use the minimum wage to put a dollar value on that work:
- Take the number of women above age 16 and multiply by 26.7 hours, which is, according to the Bureau of Labor Statistics, the average number of hours per week women spend on unpaid household work.
- Multiply this weekly value by 52, the number of weeks in a year.
- Multiply the result by the federal minimum wage.
- Divide this annual dollar amount by the consumer price index to adjust for inflation. (Note we use annual data here, aggregated at the end of each year, to make the graph easier to read.)
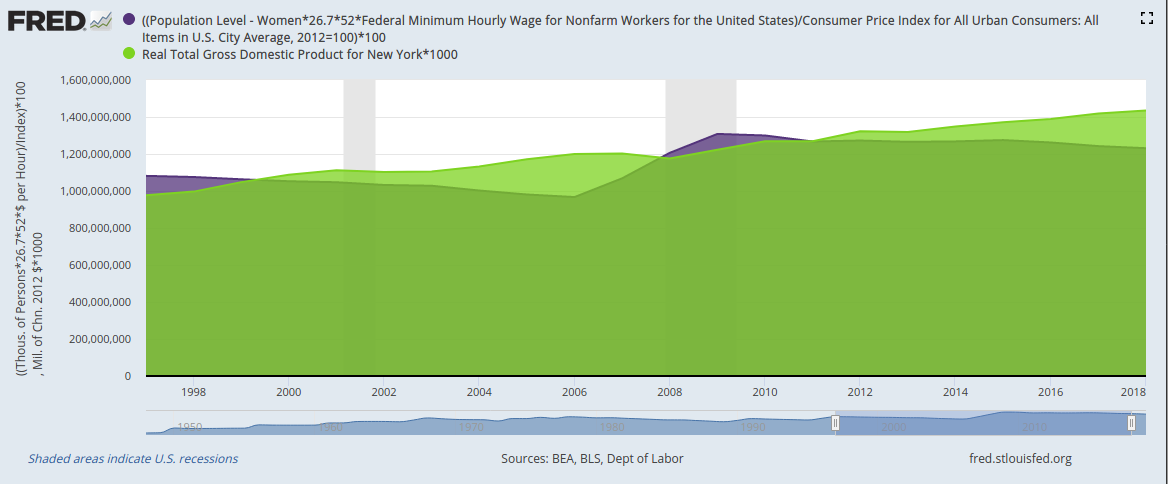
OK. Nice graph. But how big a number is this? To put it in context, let’s compare the value of women’s unpaid labor with all the economic activity recorded in the state of New York.

Customize | Download data
For 2018 (the most recent data available), the dollar value of women’s unpaid work in the U.S. was equal to 86% of all the economic activity recorded in the state of New York. In other years—say, the late 1990s and late 2000s—the value of women’s unpaid work even surpassed New York state GDP. And keep in mind this value is at the low end of the possible range because we use the federal minimum wage and not, for example, higher state minimum wages let alone market wages that correspond to the specific work being done.
How these graphs were created: For the first graph: Search for and select the population of women (series ID LNU00000002). From the “Edit Graph” panel, use “Edit Line”/”Customize data” to search for and add the series for the federal minimum wage (series ID FEDMINNFRWG) and CPI (series ID CPIAUCSL). Adjust frequency to annual. Apply formula ((a*26.7*52*b)/c)*100. From the “Format” tab, choose graph type “Area” and change the color to International Women’s Day purple. For the second graph: Start with the first graph. From the “Edit Graph” panel, adjust the units for CPI to 100 in 2012. Then use the “Add Line” tab to search for and select New York state GDP (series ID NYRGSP). Apply formula a*1000. Finally, adjust the sample period to a time when both series are available.
Suggested by Diego Mendez-Carbajo.

